AAA research shows the average Australian family is now paying $17,464 per year in land transport costs, an increase of $686 over the four quarters to March 2017.
The Australian Automobile Association’s (AAA) latest Transport Affordability Index shows the average Australian family is now paying $17,464 per year in land transport costs, an increase of $686 over the four quarters to March 2017.
The Index is based on the incomes and transport costs of a hypothetical household in each capital city that consists of a couple with children and two cars, the average household identified by the 2016 Census.
The latest edition of the AAA Transport Affordability Index shows the average Sydney family pays more than families in any other capital city, $22,238 per year, an increase of $848 over the four quarters.
Hobart households have the lowest average transport costs of any Australian capital at $14,852 annually, however this represents an increase of $737 over the four quarters.
Nationally, average household transport costs account for 13.6 per cent of the household budget. This is an increase from 13.3 per cent over the four quarters to March 2017. In comparison, household expenses relating to electricity and gas consume a far smaller share of that budget, ordinarily around one to three per cent[i].
Fuel was the number-one contributor to the national increase in transport costs over the quarter to March 2017, up $226. Fuel costs also increased by $373 over the four quarters to March. The average family now pays $1,035 in Government fuel excise each year, and for the first time, Government fuel excise increased to more than 40 cents per litre on 1 February 2017.
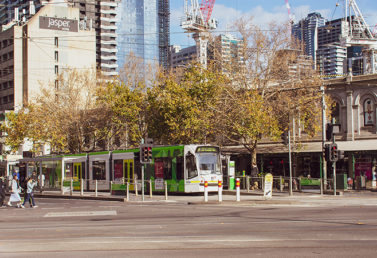
Over the March 2017 quarter, public transport increased significantly due to fare rises in Melbourne, Hobart and Canberra. Other increased costs faced by the average family included tolls, new car servicing and new car prices which had a flow on impact on car repayment costs.
The increasing costs borne by households for land transport highlights the need for all governments to develop policies and make infrastructure investments that will make transport more affordable.
Summary of findings for the March 2017 Quarter:
The latest AAA Transport Affordability Index reveals transport cost rises exceeded the consumer price index not only in the September 2023 quarter but also over the 12 months to the end of September.
read more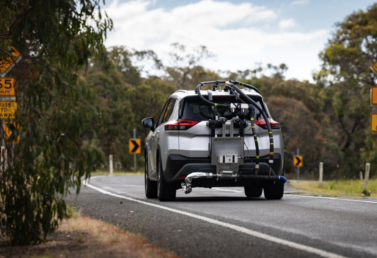
Initial results of Australia’s first program to test vehicle real-world performance show the cars tested use up to 13% more fuel on the road than they did in lab tests reported by manufacturers.
read more
The quarterly update of the AAA’s EV Index shows the Australian new vehicle market continuing to change.
read more