The nation’s first congestion benchmarking report, released by the AAA, reveals average speeds have slowed by up to 8 per cent since January 2013.
Australia’s peak motoring body has released the nation’s first congestion benchmarking report, which reveals average speeds have slowed by up to 8 per cent since January 2013.
Road Congestion in Australia uses mapping and location data to monitor and benchmark road congestion in all capital cities. The Australian Automobile Association has produced the report in partnership with HoustonKemp Economists, using data from HERE Technologies.
AAA Chief Executive Michael Bradley said: “No-one benefits from congestion and everyone pays. But if we are to develop effective solutions, we first need a strong understanding of the problem and how and where it’s changing.
“This report confirms what most people living in our major cities know all too well. But we hope it also help stimulate discussion and problem-solving so that Australia can develop smart measures to address our worsening congestion.”
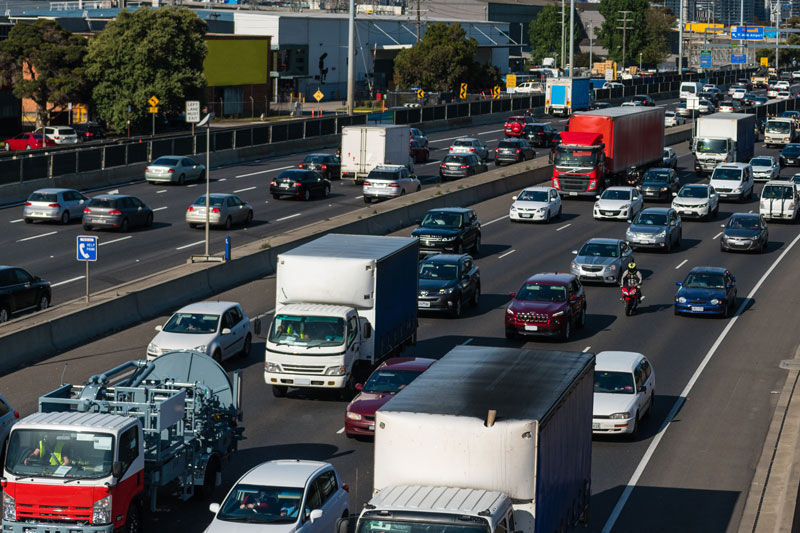
The report shows that in the five years to 30 June 2018, average driving speeds declined markedly in Australia’s capital cities. Speeds in Sydney and Brisbane fell by 3.6 per cent and 3.7 per cent respectively. In Melbourne, the slow-down was 8.2 per cent.
The report also measures variability of travel times. Highly variable average speeds make travel times less predictable and less reliable. Variability across the major capital cities has increased since January 2013, with Brisbane experiencing the largest increase at 1.2 per cent.
The report draws on anonymised trip data collected from a variety of devices, including: vehicle sensors, smartphones, portable navigation devices, road sensors and connected cars. This offers a clear picture of travel patterns while also respecting user privacy.
In 2015, land transport congestion cost Australia $16.5 billion.
Without major policy changes, congestion costs are projected to reach between $27.7 and $37.3 billion by 2030.[1]
With motorists paying record levels of motoring-related taxes, the AAA has been calling for the Australian Government to guarantee a minimum of at least 50% of net fuel excise revenue be invested in transport projects. Unfortunately, over the next four years, the proportion of net fuel excise returned to infrastructure is projected to decline to just 32% in 2021-22, well below the past decade’s average of 50.3%.
Delivering reliable, nationally consistent and regular reporting on road congestion will build on other AAA research, including the AAA’s Transport Affordability Index and Benchmarking of the National Road Safety Strategy. This helps the AAA and its member clubs advocate for better transport-related policies and greater investment in transport infrastructure and traffic management.
View the full Road Congestion in Australia report.
[1] Bureau of Infrastructure, Transport and Regional Economics, Information Sheet 74: Traffic and congestion cost trends for Australian capital cities (2015). The scenarios quoted are the Lower and Upper Baseline, respectively.
The latest AAA Transport Affordability Index reveals transport cost rises exceeded the consumer price index not only in the September 2023 quarter but also over the 12 months to the end of September.
read more
Initial results of Australia’s first program to test vehicle real-world performance show the cars tested use up to 13% more fuel on the road than they did in lab tests reported by manufacturers.
read more
The quarterly update of the AAA’s EV Index shows the Australian new vehicle market continuing to change.
read more