Australia’s peak motoring body today released its latest Transport Affordability Index which shows the average […]
Australia’s peak motoring body today released its latest Transport Affordability Index which shows the average Australian household now paying $17,147 a year for land transport, up from $16,894 in the previous quarter.
The Australian Automobile Association’s (AAA) Transport Affordability Index shows that nationally, transport costs also increased as a percentage of income over the quarter to December, from 13.4 per cent to 13.6 per cent. By comparison according to the ABS[i], household expenses relating to electricity and gas consume one to three per cent of household budgets.
AAA Chief Executive Michael Bradley said: “The AAA’s latest Transport Affordability Index shows transport cost pressures continue to grow and should act as a reminder to all governments that policy must be designed and reviewed to minimise pressure on household budgets.”
Summary of findings – Quarter 4, 2016:
Commissioned by the AAA and developed by SGS Economics & Planning, the Transport Affordability Index tracks transport affordability by analysing tax, tollways, public transport, insurance, maintenance, fuel and finance costs as a proportion of average household income across states and territories.
The Index is based on the incomes and transport costs of a hypothetical household in each capital city that consists of a couple with children and two cars, the average household identified by the 2011 Census. The Index will be updated regularly by the AAA, and can be downloaded here.
The latest AAA Transport Affordability Index reveals transport cost rises exceeded the consumer price index not only in the September 2023 quarter but also over the 12 months to the end of September.
read more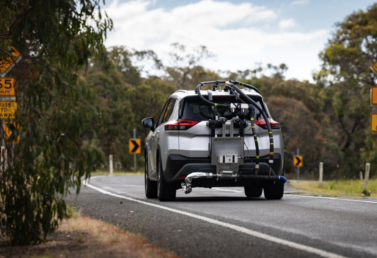
Initial results of Australia’s first program to test vehicle real-world performance show the cars tested use up to 13% more fuel on the road than they did in lab tests reported by manufacturers.
read more
The quarterly update of the AAA’s EV Index shows the Australian new vehicle market continuing to change.
read more